Mapping Potential Criminal Area using Street Profile Analysis and WebGIS

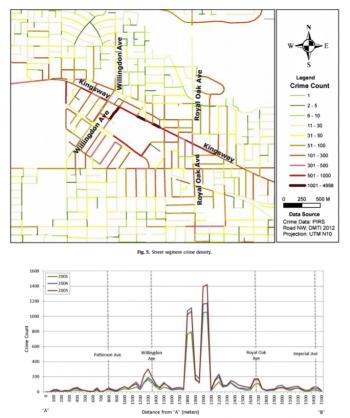
According to the Central Bureau of Statistics (BPS) of East Java in FY 2011-2013, Malang city being the second highest crime after Surabaya City. Prevention efforts should be made to the achievement of public security. One of the prevention of crime is to visualize crime mapping areas that available to the public and easier to be understood. In this study, researchers will use a method of mapping using Street Profile Analysis and Choropleth map. Street Profile Analysis method used to visualize the crime scene, the number, and time information in the graph (as shown in Figure above by Spicer et al, 2016). Meanwhile Choropleth map used to geo-visualize the crime-prone areas by utilizing the Sentinel-2 satellite imageries to classify the data into a buildings density and vegetation density, then it will be overlaid with crime scene point. The software development method that will be used is Rational Unified Process (RUP) framework. The output of this research will be handed over to the Criminal Investigation Unit of POLRESTA Malang in the form WebGIS technology.